

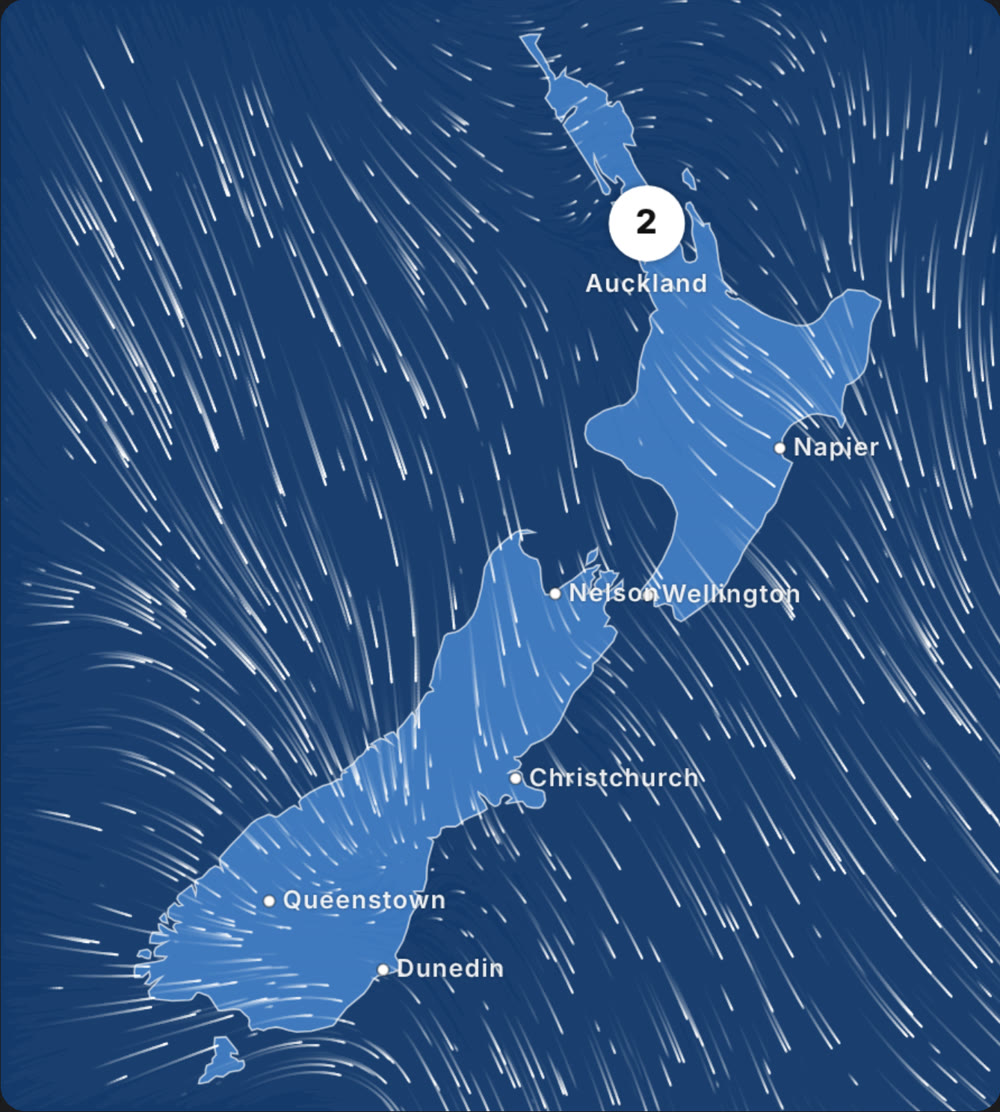
Before anything else, every buyer asks the same question: is there enough wind where I live? Since 15 November 2026 the payback calculator on our wind turbine pages helps answer it with real data. It shows today's wind across the country, moving on a map, next to the yearly average that the payback is worked out from.

Open the calculator on the TESUP Atlas page and you will find a new section called “Live wind right now”. You can spot it before you even open the calculator: the green “Will it pay for itself?” button at the bottom right of the product page now carries a small dark chip with the current wind speed, for example 2.0 m/s.
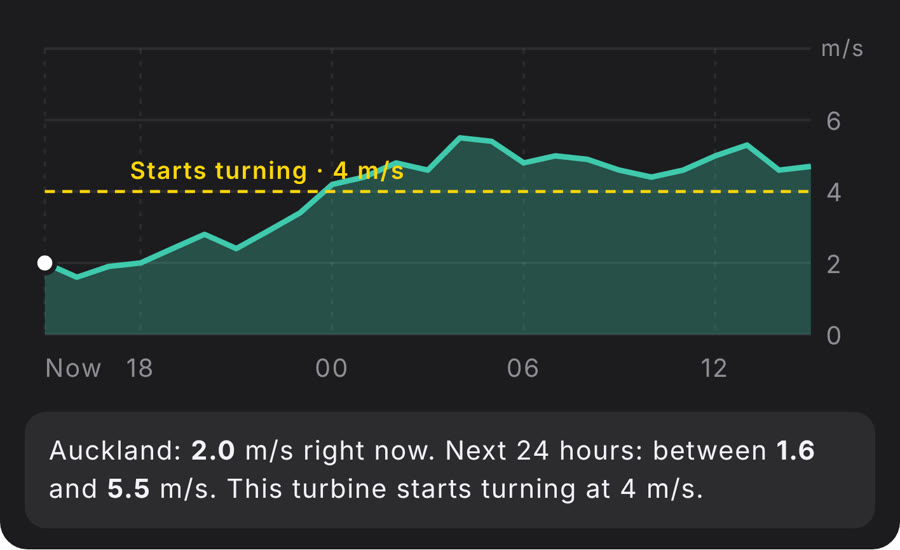
The yellow line: when does the turbine start turning?
Across the chart runs a yellow dashed line. It marks the turbine's start speed (often called the cut-in speed), and it depends on the blade set:
- TESUP Atlas, Low-Wind blades: 2 m/s
- TESUP Atlas, Moderate-Wind blades: 4 m/s
- TESUP Atlas, High-Wind blades: 5 m/s
- TESUP Magnum: about 6 m/s
Today's wind vs the yearly average: an honest comparison
Here is a real example, read from the calculator on 15 November 2026 at about 15:50 UTC:
Auckland: 2.0 m/s right now. Next 24 hours: between 1.6 and 5.5 m/s. This turbine starts turning at 2 m/s.
- Low-Wind blades: ≈ 1.2 kWh — about NZ$0.35 of electricity · turning 22 of 24 hours
- Moderate-Wind blades: ≈ 1.0 kWh — about NZ$0.29 of electricity · turning 15 of 24 hours
- High-Wind blades: ≈ 0.4 kWh — about NZ$0.11 of electricity · turning 5 of 24 hours
For the same turbine with the first blade set, the calculator's average day comes to ≈ 5.6 kWh (6.0 m/s).
That gap is the whole point of the feature: one quiet day is not the yearly average. Over a year, wind comes in calm spells and windy spells, and the windy days carry far more energy than the calm ones. So the payback, the yearly energy and the savings are still worked out from the long-term average. Today's wind sits next to that estimate and does not change it.
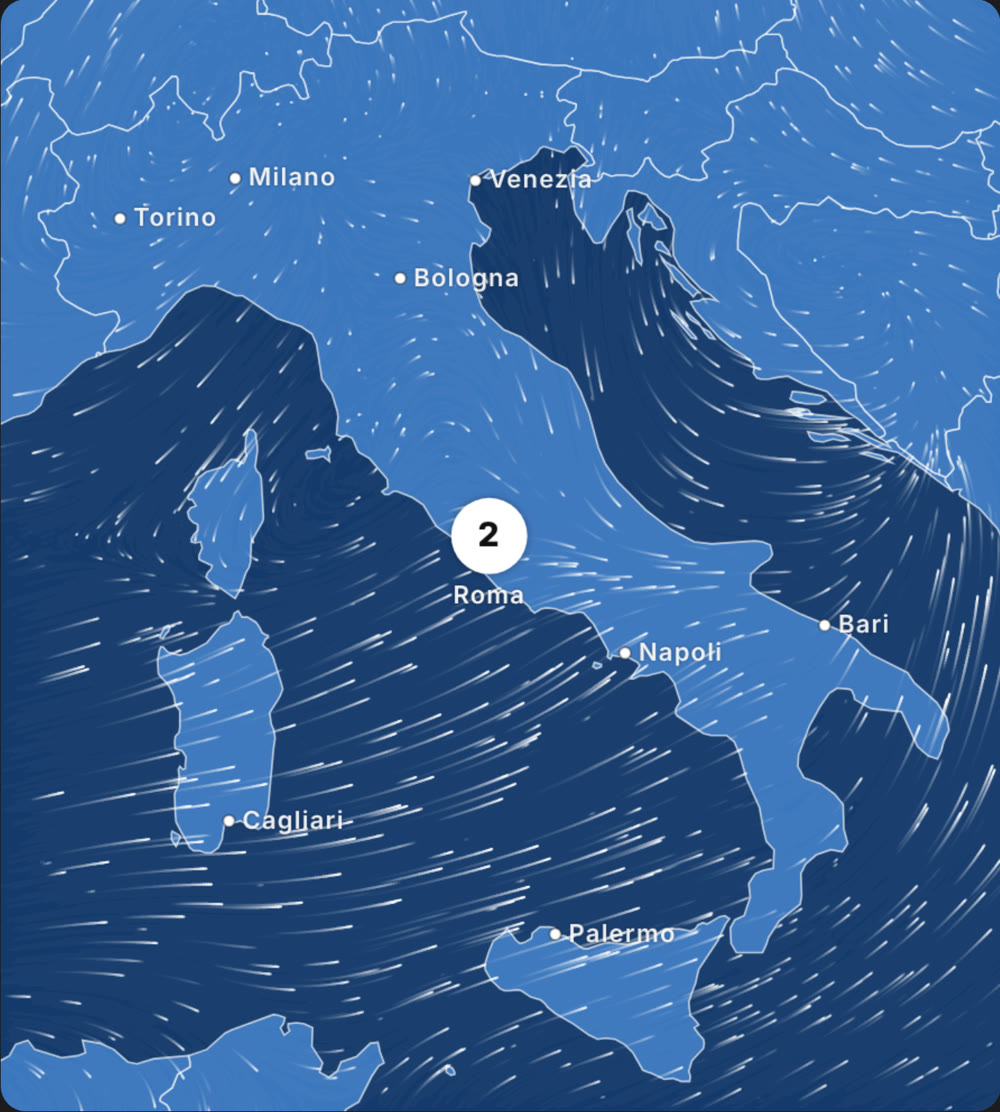
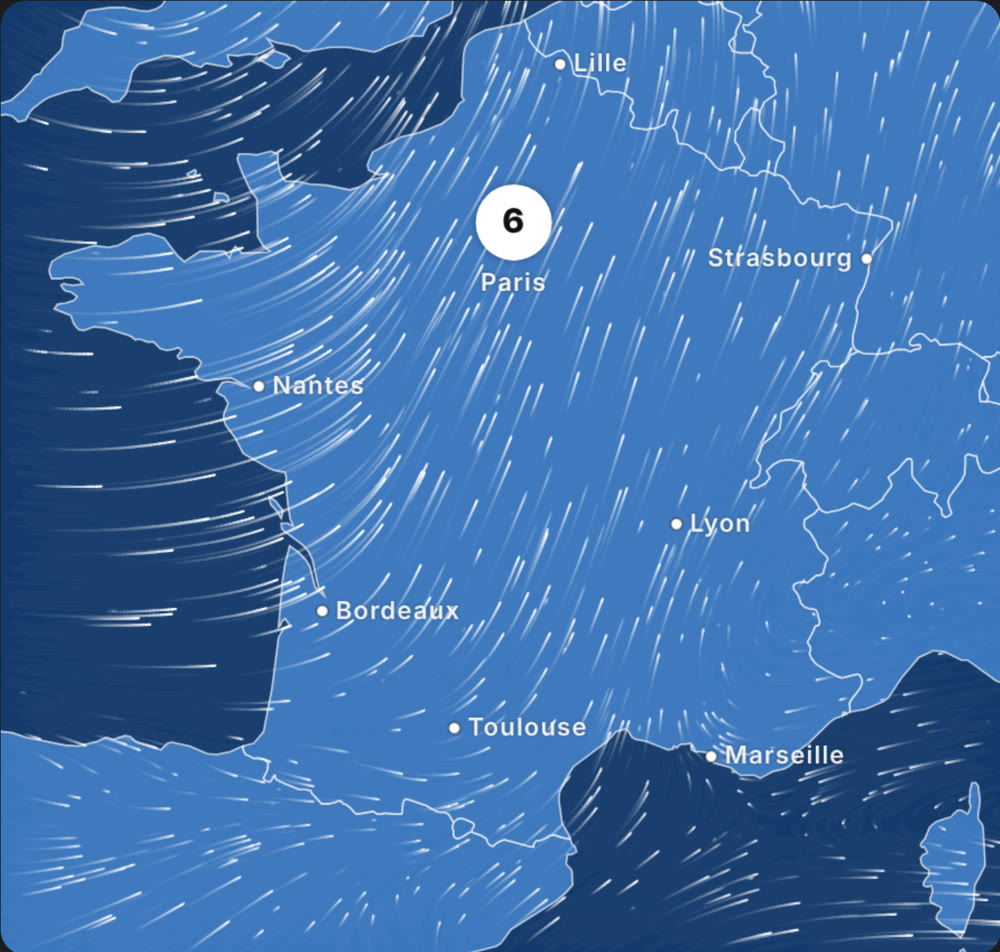
The wind right now in other countries
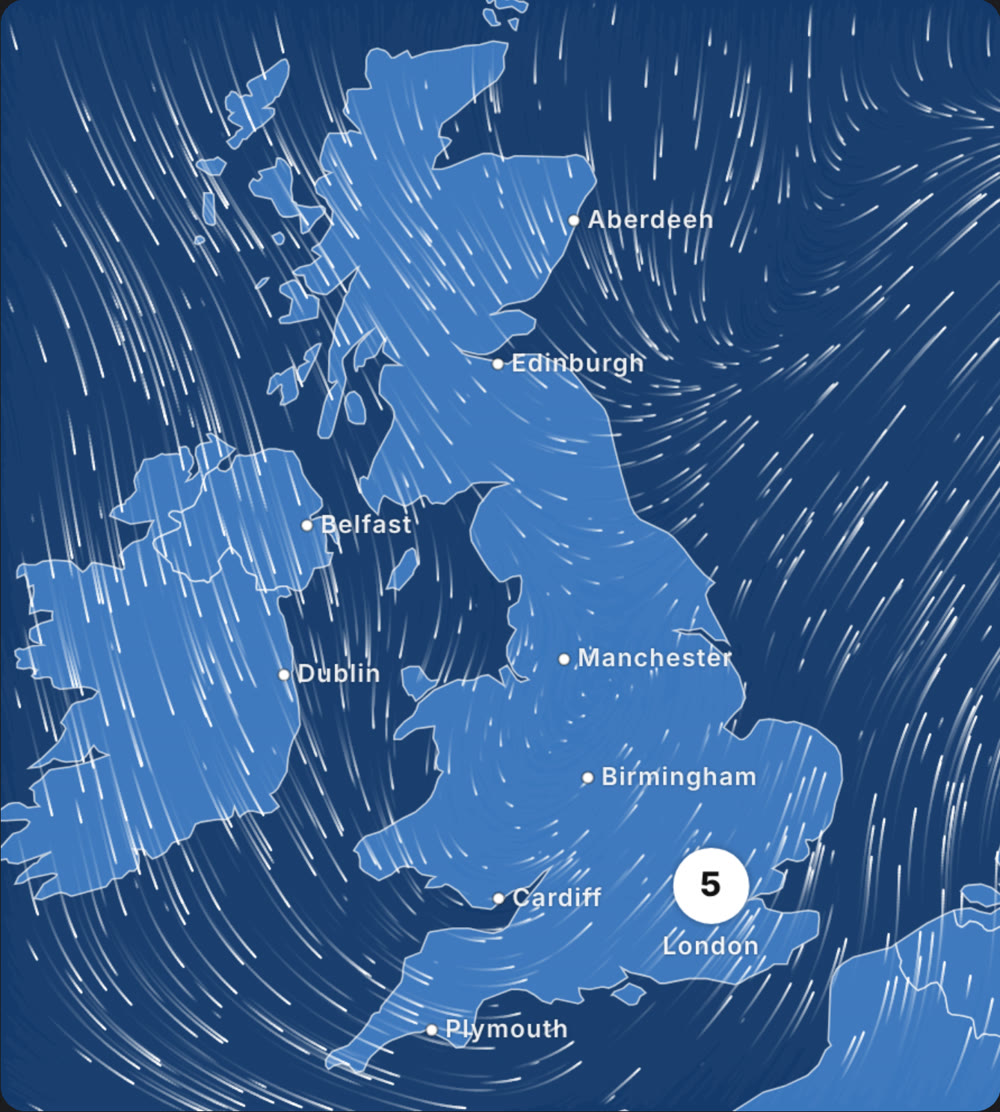
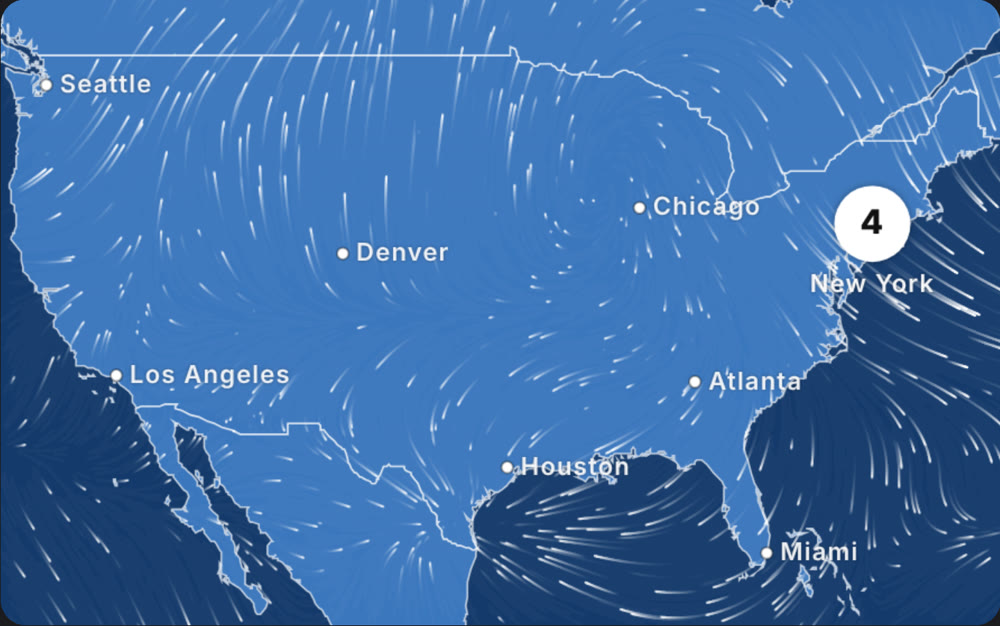
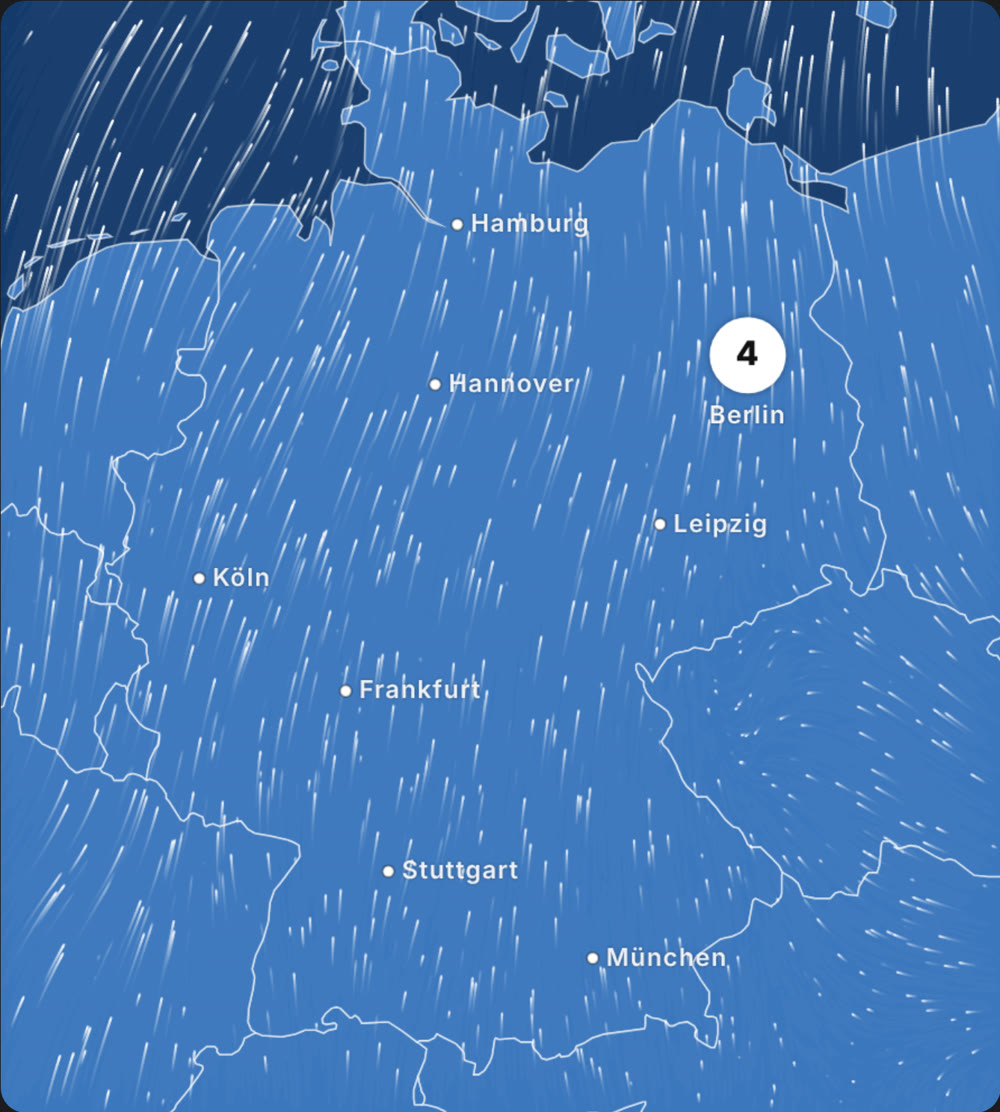
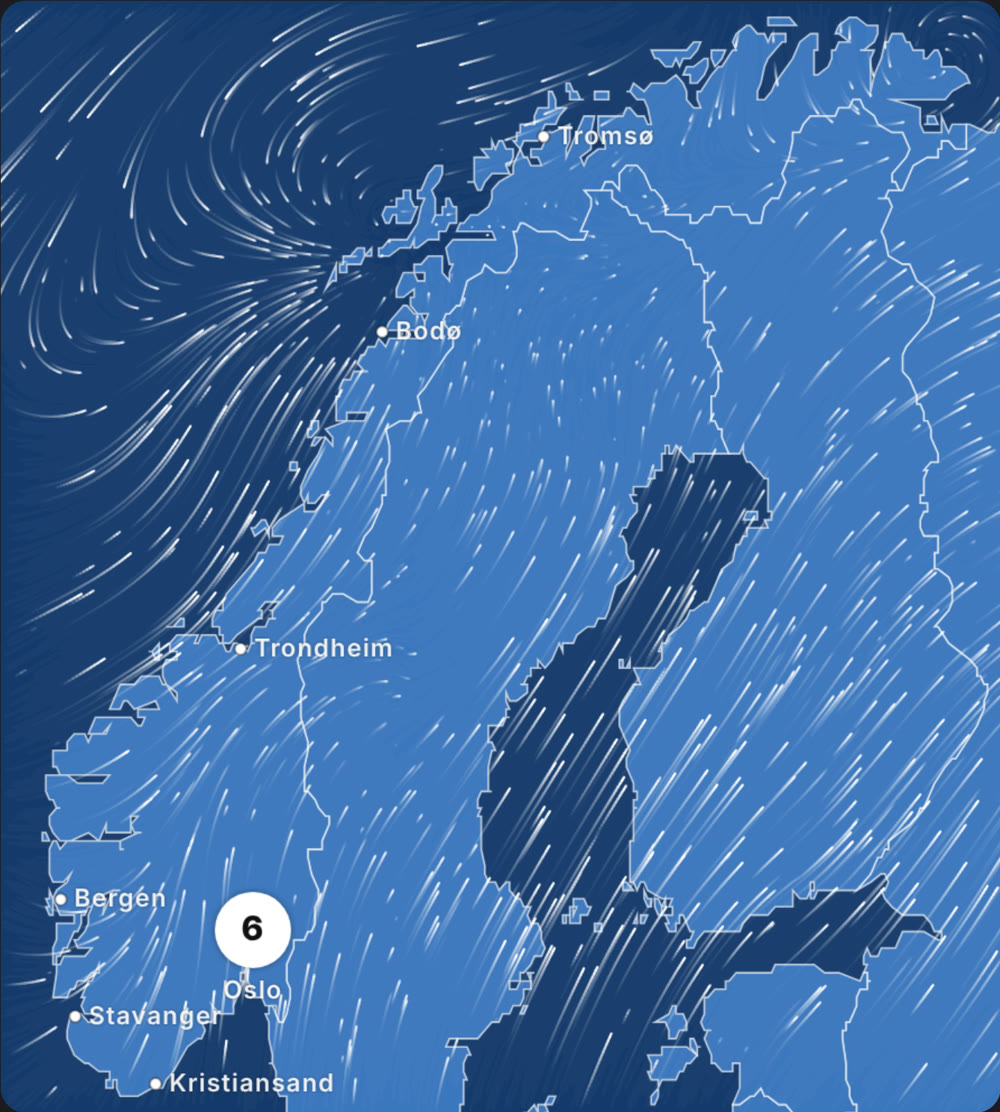
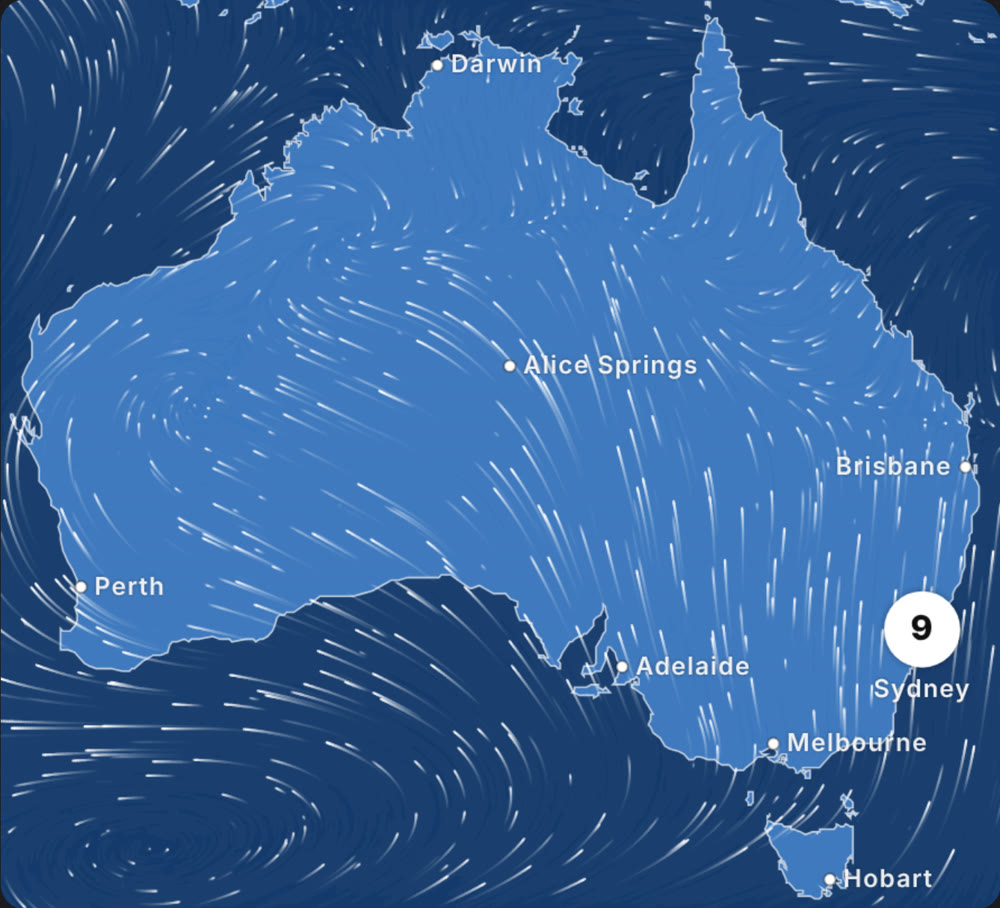
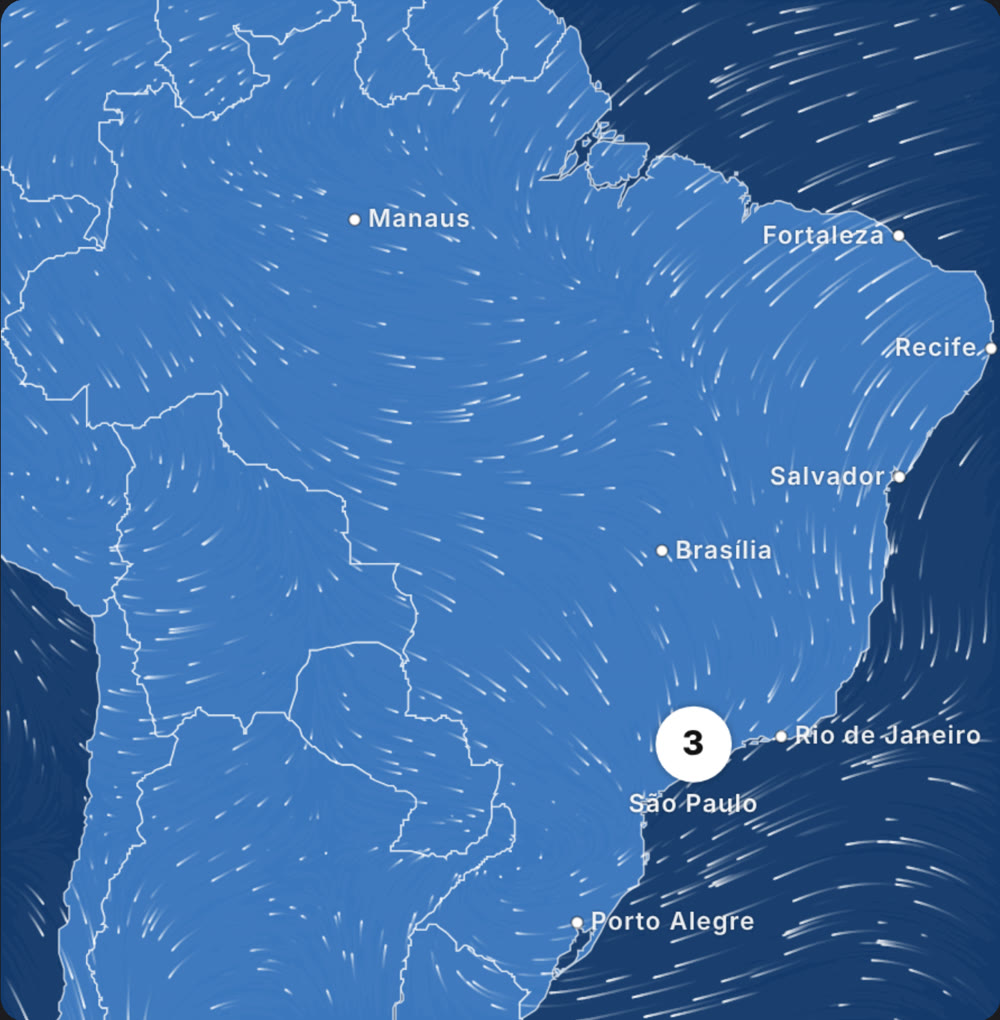
The same live map runs on every one of our country stores. This is how the wind looked across some of them at the same moment:
How to use it in three steps
- Open the TESUP Atlas or TESUP Magnum page.
- Tap the green “Will it pay for itself?” button at the bottom right.
- Choose where the turbine will stand (sheltered, suburban, open countryside, hilltop or near the coast, coastal), or use the slider. The payback updates, and “Live wind right now” shows today's picture next to it.
Open the TESUP Atlas page and tap “Will it pay for itself?”
Forecast data: MET Norway (CC BY 4.0). Map outlines: Natural Earth. All energy and savings figures are estimates from the calculator; real output depends on the site.