

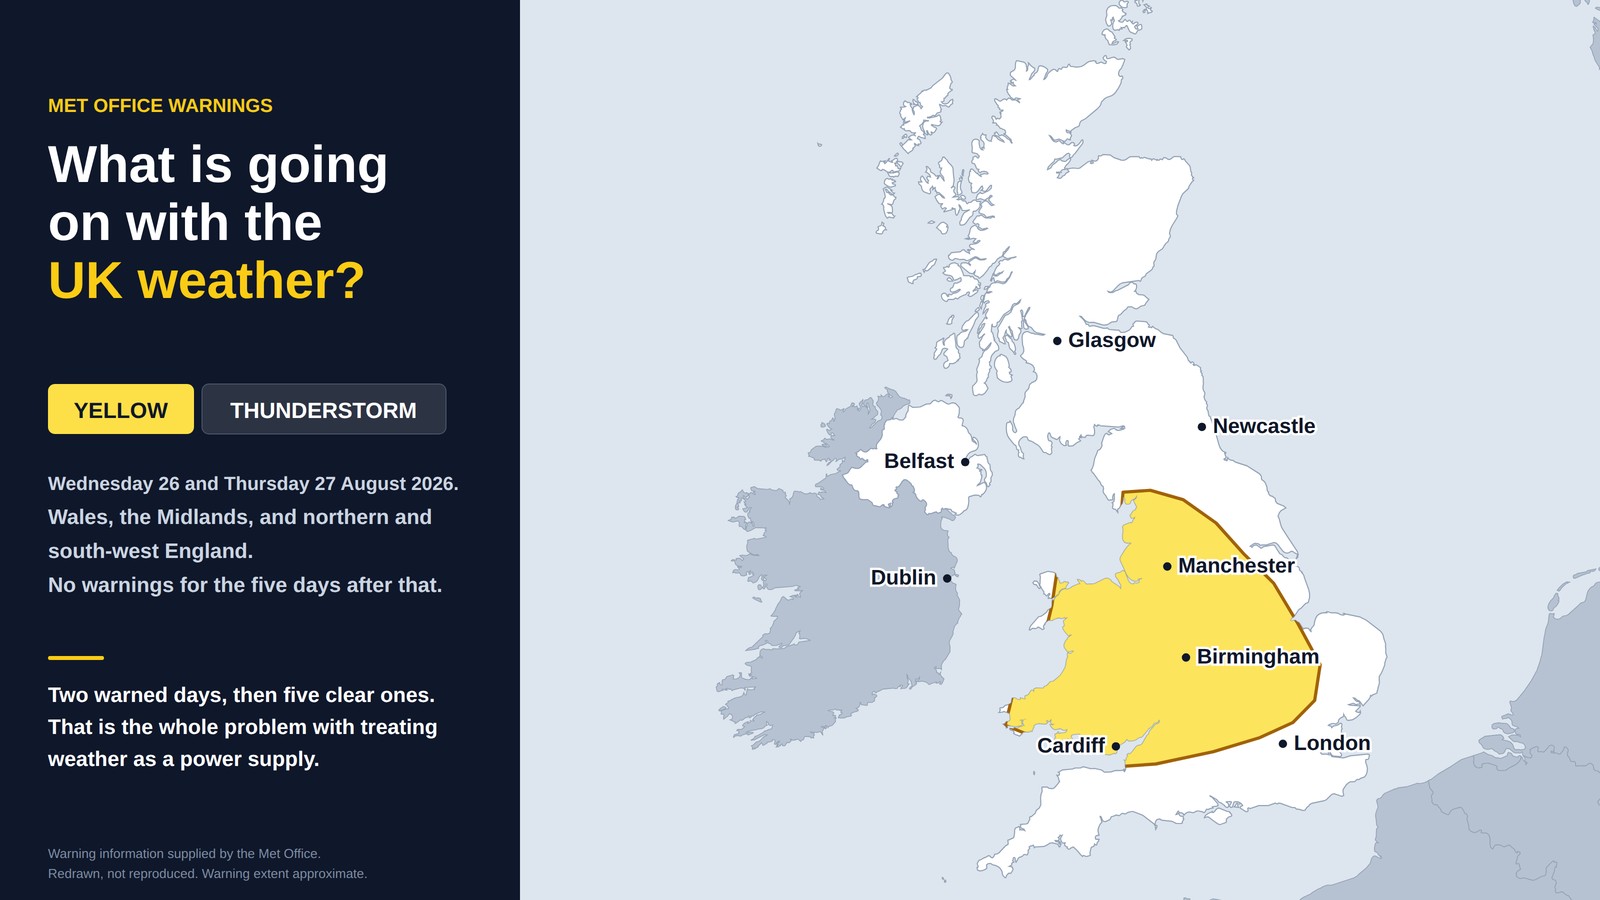
There was a yellow thunderstorm warning across much of the UK this week. That is weather. It tells you almost nothing about the climate, and anyone who tries to sell you something on the strength of a single warning should be ignored — including us.
What does tell you something is a long series of measurements taken the same way for a very long time. The Met Office keeps one, going back to 1884, and published its latest reading of it in July 2026. It says something more interesting than “Britain is getting hotter”, and the interesting part is not the part that makes headlines.
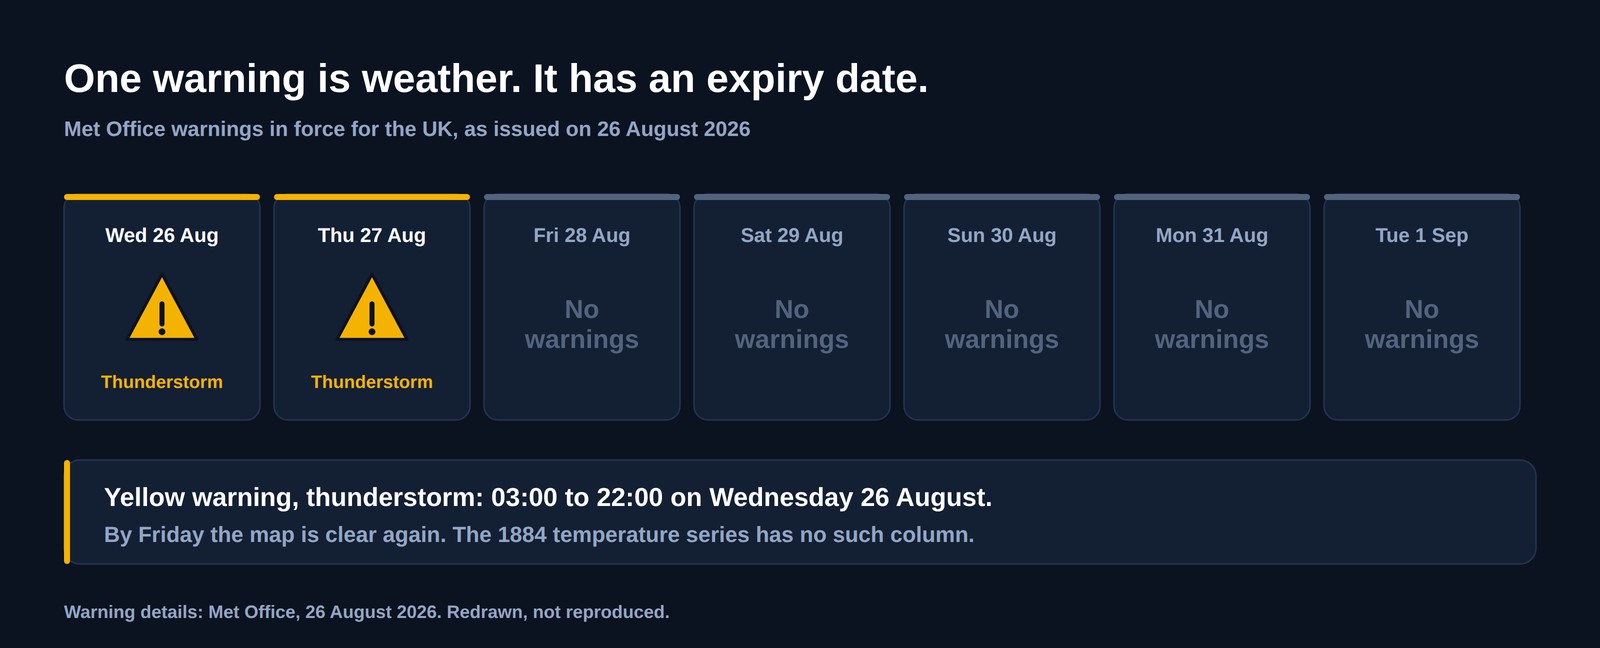
The warning that prompted this piece — and the five clear days behind it. Warning details: Met Office, redrawn rather than reproduced.
One warning is weather. A century of records is climate.
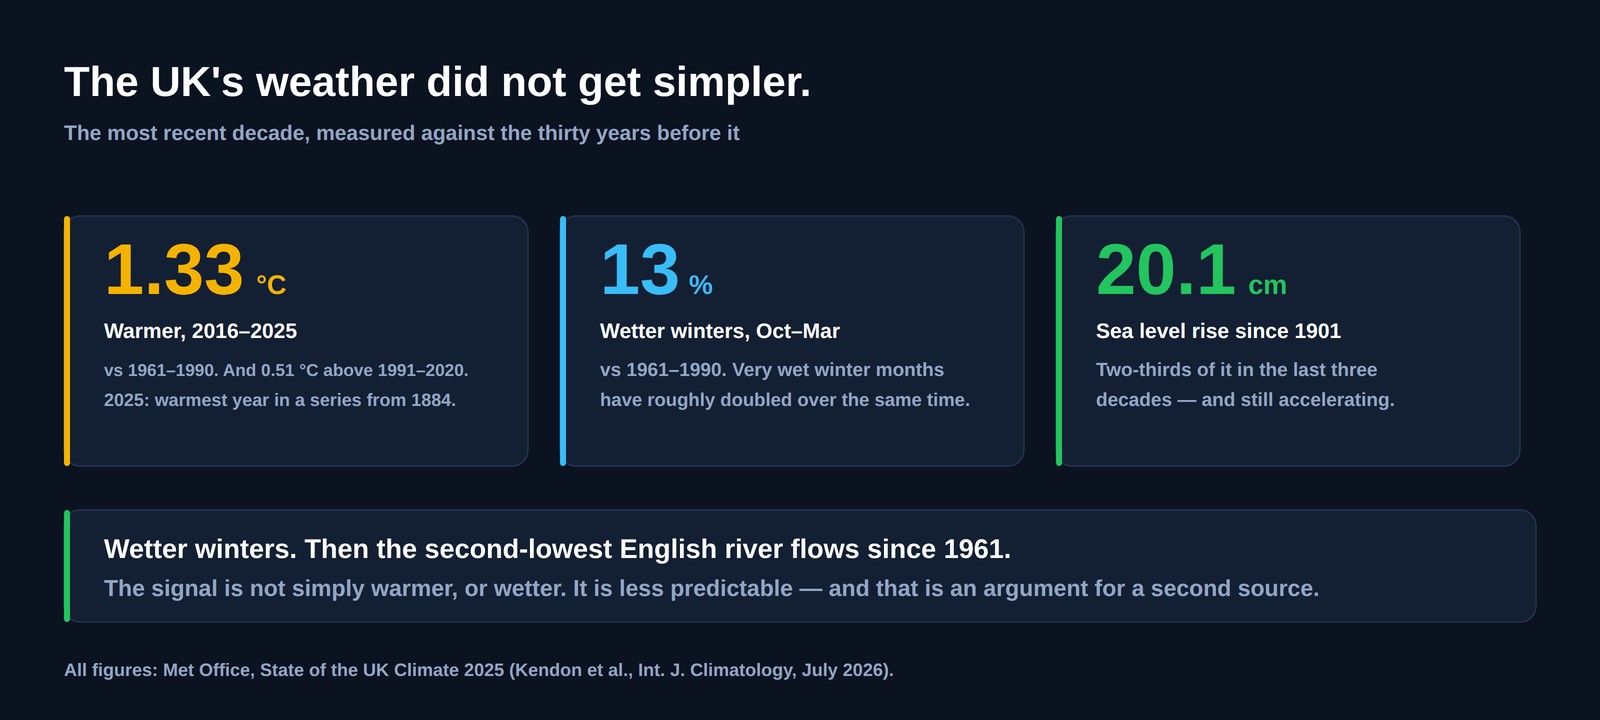
2025 was the warmest year in the UK series that begins in 1884. Four of the last five years sit in the top five. The most recent decade, 2016–2025, ran 0.51 °C above the 1991–2020 average and 1.33 °C above 1961–1990, and the UK has been warming at roughly 0.25 °C per decade since the 1980s.
A single record year proves very little on its own; records happen. What is harder to argue with is that they stopped being rare. When the warmest year in a 140-year series keeps arriving, and the runners-up are all recent, the series itself has moved.
Content supplied by the Met Office — State of the UK Climate 2025, published July 2026.
The winters got wetter. Then the summer ran dry.
Across 2016–2025 the winter half-year, October to March, was 3% wetter than the 1991–2020 average and 13% wetter than 1961–1990. Very wet winter months — ones with twice the 1961–1990 average rainfall — have roughly doubled in frequency.
And then, in the same decade, the total flow of England's rivers between March and August 2025 was the second lowest in a record starting in 1961. Lower than every major summer drought since, apart from 1976.
Both of those are true at once. The signal is not simply warmer, or wetter. It is less predictable.
That is the sentence worth taking away, and it is a duller one than the headlines. A country can be getting wetter in winter and running its rivers dry in summer in the same ten years, because what is changing is the distribution, not just the average. Planning around an average is exactly what stops working.

Blossom in London in early March. Not proof of anything on its own — but this is what a shifting distribution looks like from a pavement.
And this year, the Pacific has a say.
There is one more thing sitting over this particular year. The Met Office has declared an El Niño for 2026, and current guidance is that it will be a very strong one, with sea-surface temperatures in the central and eastern tropical Pacific running more than 2 °C above normal.
It is worth being precise about what that does and does not mean for Britain, because it is routinely overstated. El Niño is a Pacific phenomenon, and its effect on UK weather is indirect. It does not deliver a thunderstorm to Nottingham on a Wednesday in August. What it does is shift the odds for the months that follow: a higher chance of a milder, wetter and windier autumn and early winter.
Set that against the summer just gone, which was hot and dry — ten days above 35 °C in 2026, three of them reaching 37 °C. A parched summer followed by a forecast of a wetter, windier autumn is the same pattern as the rest of this page, arriving inside a single year rather than across a decade.
And it points at the same conclusion. If the coming autumn and winter are likelier than usual to be wet and windy, that is precisely the half of the year when a solar roof gives you least and a turbine gives you most.
Frost is disappearing, and that changes what a house does.
Two of the clearest numbers in the report are about cold, not heat. Compared with 1961–1990, the most recent decade has had less than half as many icing days — days that never rise above freezing — and hard frosts, below −8 °C, have fallen by a factor of more than four. At the other end, Greater London has had more than four times as many days above 30 °C and nights above 18 °C.
For a household that is not an abstraction. It is less heating in some winters, more cooling in some summers, and a demand curve that no longer looks like the one your house was designed around. We are not going to tell you whether that is good or bad for your bills, because it depends entirely on your house — but it does mean the shape of what you use is moving, not just the total.
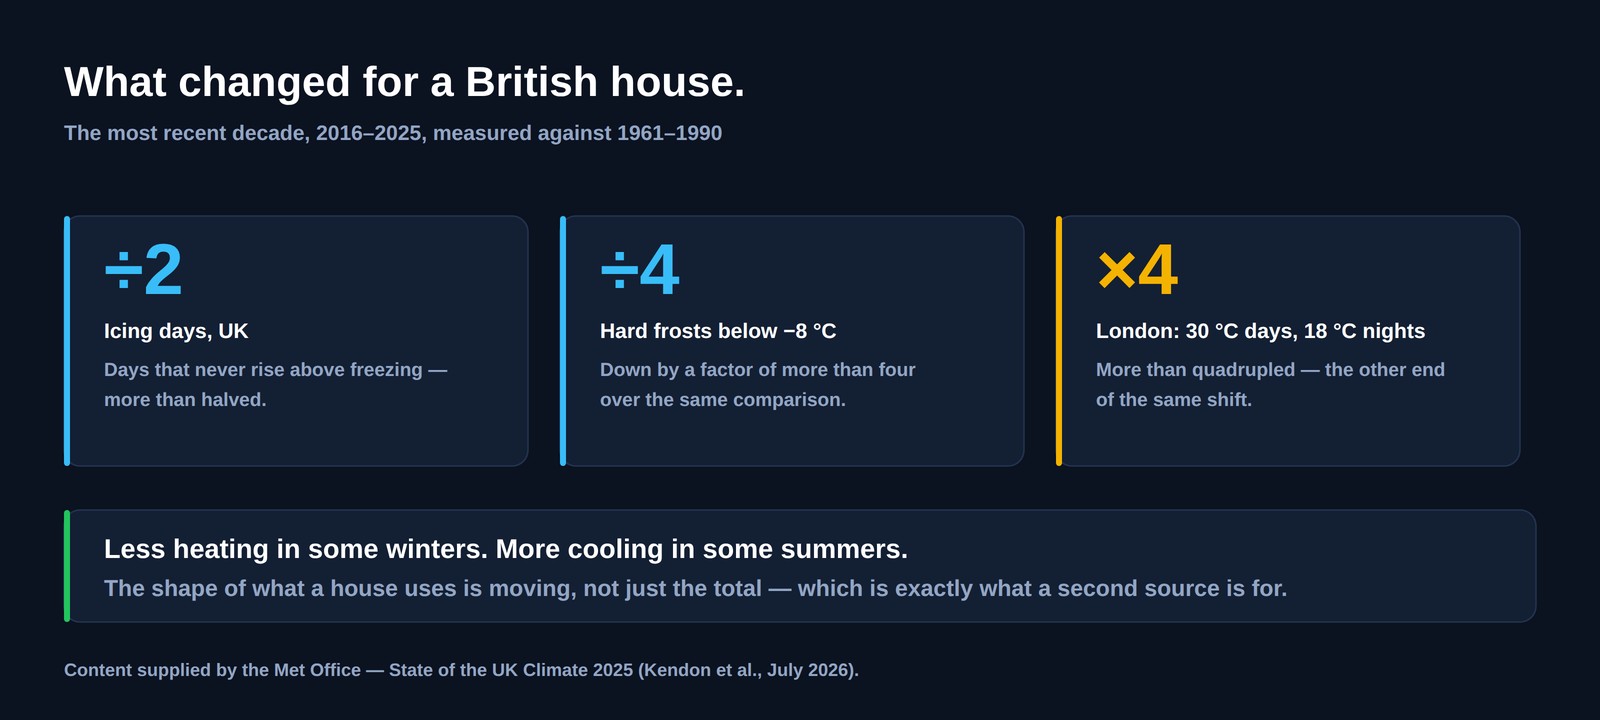
Content supplied by the Met Office — State of the UK Climate 2025.
Sea level is the measurement that does not argue back.
Temperature records invite debate about instruments and station moves. Tide gauges are harder to talk your way around. UK sea level has risen by about 20.1 cm since 1901, with a likely range of 16.6 to 23.6 cm, and roughly two thirds of that has happened in the last three decades — 13.9 cm of it between 1993 and 2025 alone. The rate is increasing.
That matters to anyone on a coast, because sea level is the baseline a storm surge is added to. The same storm arriving on a higher sea reaches further inland. If you live near the water and you are choosing where to put anything — a turbine, a heat pump, a consumer unit — that is the number to think about, not the forecast for Tuesday.

Every centimetre of sea level rise arrives here first, and only later on the forecast.
So what does a turbine on your roof actually do about this?
Nothing measurable. We will not pretend otherwise. One household wind turbine does not move a national emissions figure, and if reversing climate change were the only reason you were considering one, you would be better off spending the money on insulation and voting.
What it does is narrower and more useful. If the thing that is changing is reliability rather than average, then the sensible household response is not a bigger version of one source — it is a second one that fails at different times. In Britain the windy half of the year runs roughly October to March, which is exactly the half that is getting wetter and stormier, and exactly when the days are shortest and a solar roof produces least. The two do not fail together, and that is the whole argument.
The caveats are the same ones we give everybody. A windy country is not a windy garden: the national maps say very little about the lee of your neighbour's house. Measure your own site through a windy season before you buy anything, from us or from anyone. Know how to brake the machine before a front arrives. And check the mounting every autumn, because the winters in that dataset are the ones getting wetter and windier.

A national wind map says almost nothing about the gap between two buildings, or the lee of a hedge in Devon.
The honest summary of British weather is not that it is getting worse. It is that it is getting harder to plan around.
Everything above is an argument for not depending on one thing.
Every climate figure on this page — the 1884 series, 2025 as its warmest year, 0.51 °C and 1.33 °C for 2016–2025, 0.25 °C per decade, winters 3% and 13% wetter, icing days and hard frosts, the London heat counts, English river flows for March–August 2025, and sea level at 13.9 cm since 1993 and about 20.1 cm since 1901 — is published by the Met Office in State of the UK Climate 2025 (Kendon et al., International Journal of Climatology, July 2026). The El Niño declaration for 2026, its expected strength, and the description of its UK effect as indirect and weighted towards autumn and early winter are also the Met Office's, as are the 2026 summer temperature counts. We have not attributed any single storm, warning or dry summer to climate change, because a single event cannot be attributed that way from a report like this one. The turbine specification referred to is our own published data and is checkable on the product page. No customer is named here.